
The Heat Map Planner
Plan your whole screening
network on one map
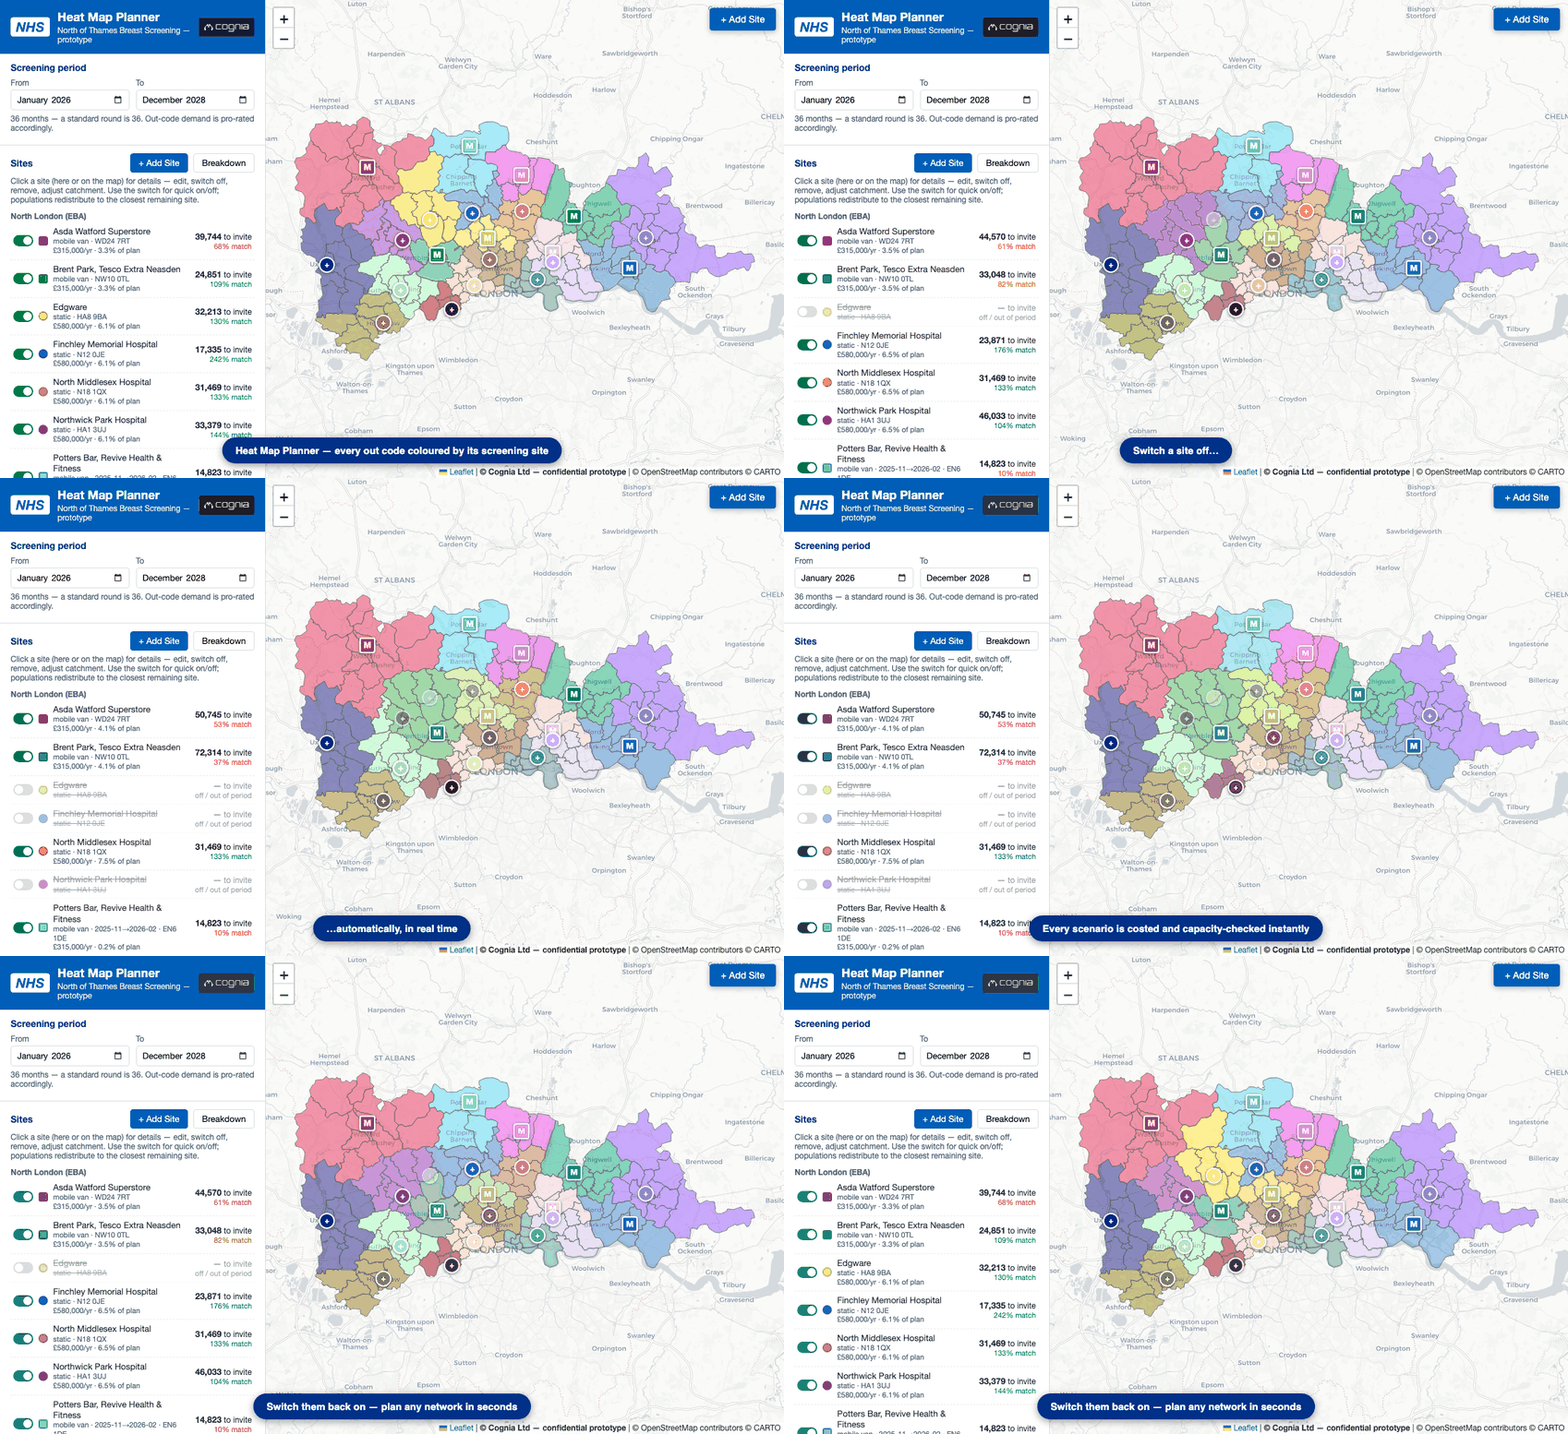
This is the tool most services come to us for. Add a site, switch one off, move a van, and watch the catchments, costs and coverage redraw straight away. Here it is running on real London data.
What it does
Try a change, see the cost, keep or undo it
- Postcode districts recolour the instant you add, remove or switch off a site
- Populations move to the nearest remaining site on their own
- A running-cost model per site, down to the cost per woman screened
- Set a budget and get ranked options for how to hit it
- Multi-year journeys for mobile vans, planned against when women are actually due
- Save two plans and compare them side by side before taking one to the board
The rest of the toolkit
Everything from postcode
to appointment
Planning the network
Where the sites should be
Model the best mix of permanent sites and mobile vans, and compare whole scenarios before you change anything on the ground.
Real travel times, at scale
Actual public-transport journeys between tens of thousands of postcodes and every candidate site, Google routing, plus our own clustering so a city-sized search finishes in reasonable time.
Staff and capacity
Fold in rotas, staff numbers and changing rents, so a plan that looks affordable also tells you how many mammographers it actually needs.
Where demand is heading
Estimate where screening demand will grow next, from local population change and the ages already on your list.
Day-to-day scheduling
Tools for the office to plan appointments across current and possible sites, with the capacity maths built in.
Dashboards & costing
Coverage maps, live views of bookings and DNAs, and costed comparisons, from moving one van to redrawing the whole site mix.
Getting more people to turn up
Handling routine queries
Take the weight off the call centre by answering the common questions and sorting the routine requests automatically.
Easier booking
Online booking and appointment management where it fits, simpler for the patient, lighter for staff.
Catching no-shows early
Spot who's likely to miss an appointment and nudge them in time, or fill the slot before it goes to waste.
From a London screening catchment we planned in 2024
The analysis behind it
What picking the right
site actually takes
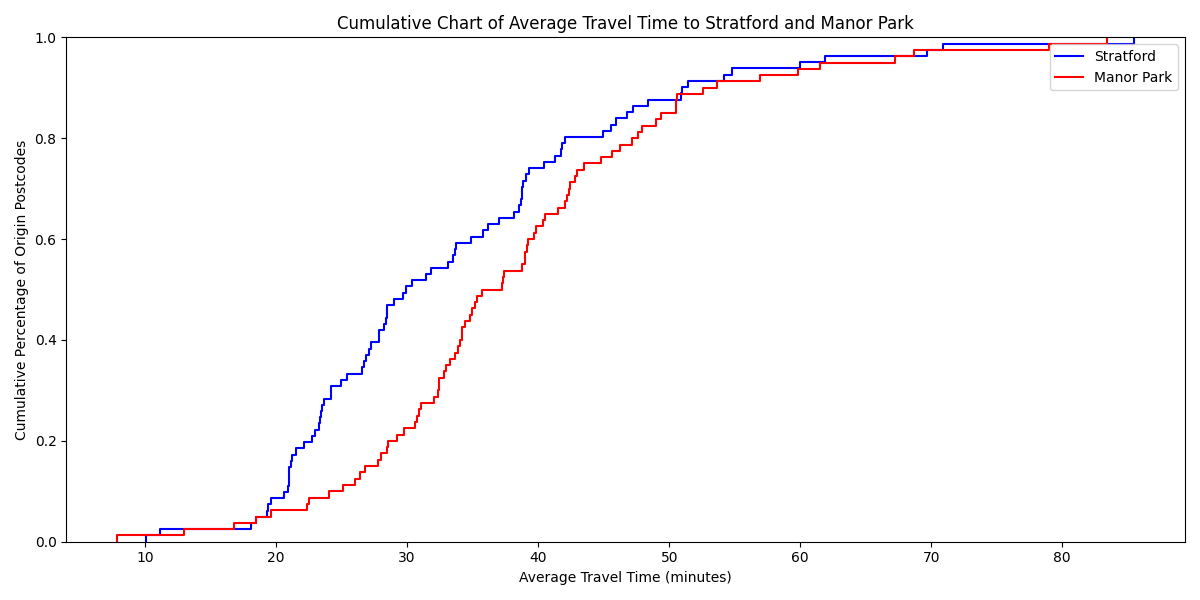
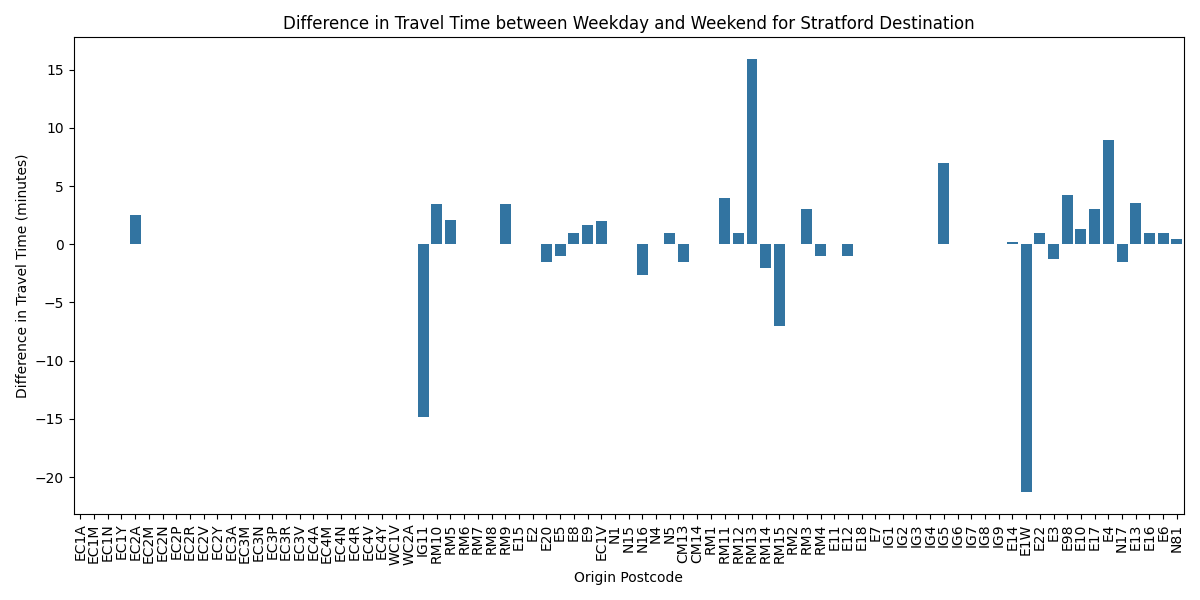
To recommend a location we model real public-transport journeys from tens of thousands of postcodes to every candidate site, cluster them so a city-scale search stays tractable, and compare who each option actually reaches. Here is some of that work for two east-London candidates, Stratford and Manor Park.
Request a demo
Twenty minutes is usually enough to work out whether we can help. Tell us about your service.